Windguru is an essential tool for every kitesurfer: wind, gusts, direction, wave height, cloud cover… everything is there. But all this data can seem complex at first glance.
No worries! In this guide, we explain how to read Windguru simply and effectively, so you know exactly where and when to go kitesurfing.
The goal? To make every session in Tarifa (or anywhere else) as fun as possible with zero weather surprises.
So, ready to become a Windguru pro and enjoy your sessions at the perfect time?
Search a kitesurf spot on Windguru
The first step is to find your kitesurf spot on Windguru.
The fastest way is to search directly on Google by typing Windguru + the name of your spot.
So, when we want to know how the wind will be on the Tarifa spots in the coming days, we most often search on Google for: “Windguru Los Lances” or “Windguru Valdevaqueros”
It is also possible to search for different spots, locations, or cities directly from Windguru at the top left of the homepage next to the site logo.
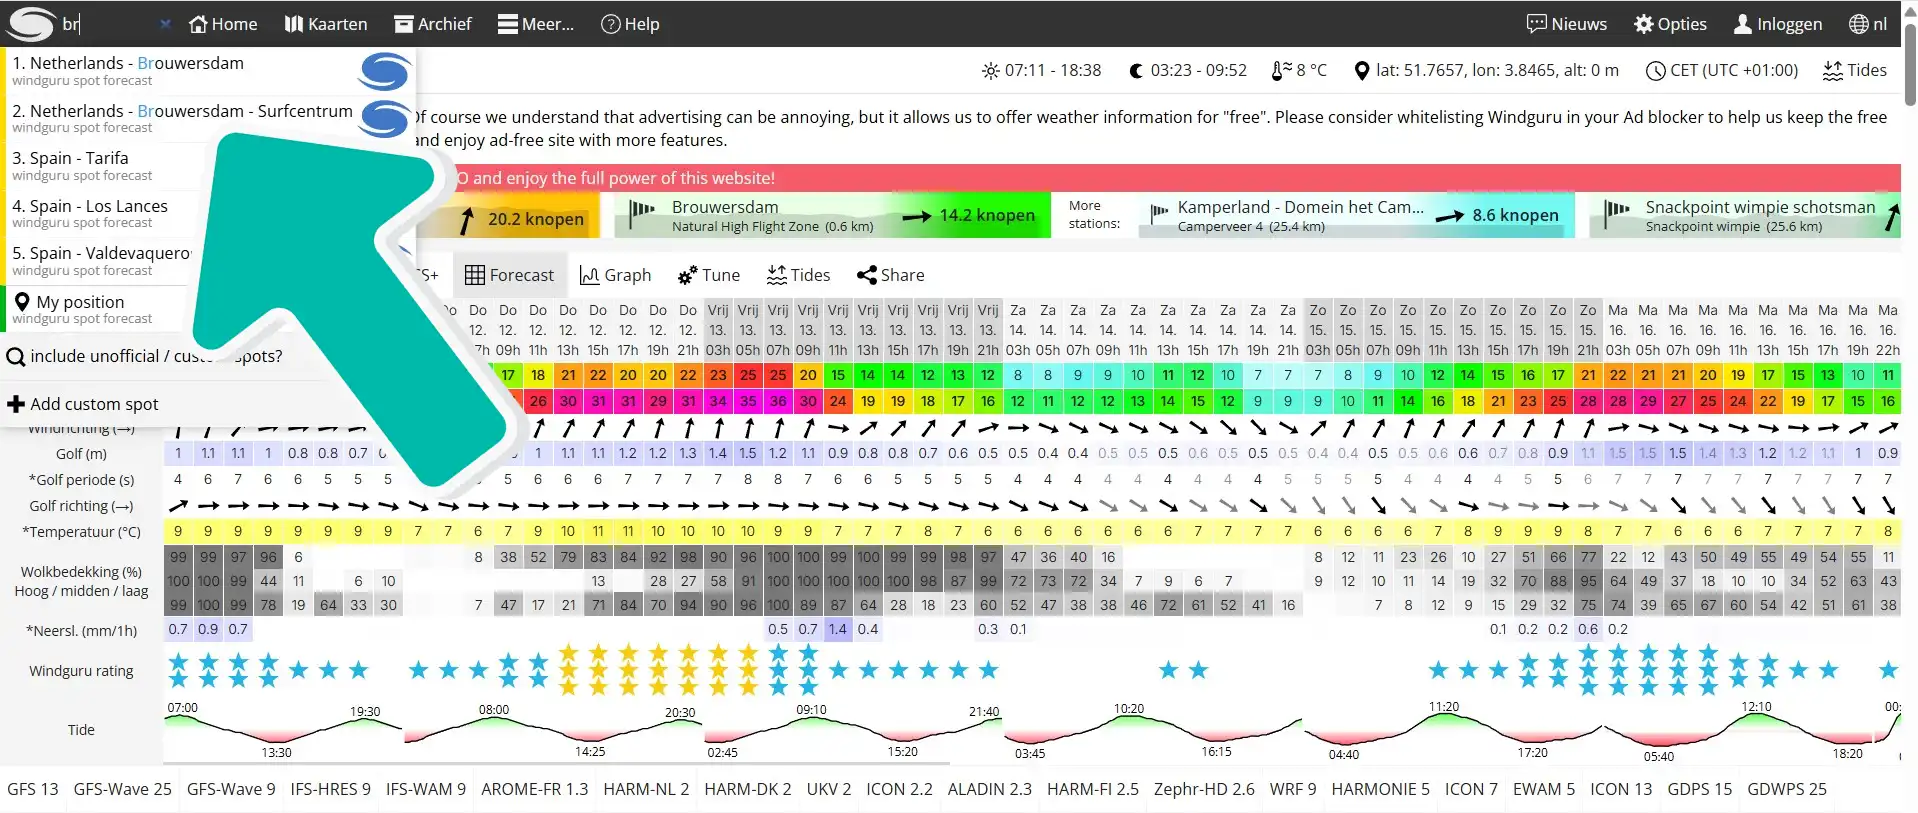
Understanding Models and Grids on Windguru
The models are the many tables that your Windguru page displays horizontally, at the top and left of the chart, where you can see which model is being used: WG – GFS13 – WRF27 – ICON 7 or Zephr-HD 3… what does it mean?
The models and grids available on Windguru correspond to the different tables you find while scrolling on the site or app. You may notice significant differences in the forecasts for the same date.
So, how can you make sense of it all, and what are these different weather models for?
If you want more info on wind statistics specifically for Tarifa, feel free to check out our wind conditions guide in Tarifa!
Weather Models:
On Windguru, weather forecast models are presented as horizontal tables, each with a specific purpose based on the accuracy and time scale of the data.
A weather model is a numerical simulation that predicts the evolution of atmospheric conditions using computer calculations.
These models use various data sources, including satellite observations, ground weather stations, as well as sensors on commercial airplanes or ships.
Among the commonly used models are:
General Weather Models
GFS 13 km (Global Forecast System) – USA
WRF 3 km and 9 km (Weather Research and Forecasting)
ZEPHR-HD 4 km and 9 km (Zephyr Model) – Spain & Portugal
ICON 7 km (Icosahedral Nonhydrostatic) – Europe
HIRLAM 7.5 km (High Resolution Limited Area Model) – Europe
Models for Swell and Waves
GFS-WAVE 16 km
GWAM 27 km
EWAM 5 km
GDWPS 25 km
Each model has its own specifics in terms of resolution and coverage area, allowing users to choose the one that best suits their needs for planning kitesurfing sessions.
Grids (or Resolution)
On Windguru, each weather forecast model is defined by a spatial resolution, expressed in kilometers. This resolution corresponds to the size of the grid used for calculations: the larger the grid, the wider the area covered by each data point.
For example, a model with a 9 km resolution (like WRF 9 km) divides the territory into 9 km squares, providing forecasts over a longer period, usually more than 3 days. However, this approach may lack precision for local phenomena.
Conversely, a model with a finer resolution, such as WRF 3 km, uses 3 km squares. This increased granularity allows for capturing more precise details of local weather conditions but limits the forecast period to around 48 hours.
In short, there is a trade-off between the temporal range of forecasts and their spatial accuracy: finer resolutions provide more detailed short-term forecasts, while larger resolutions offer general trends over a longer period.
Reliability of Weather Models: Can Windguru Be Wrong?
A model is a computer simulation that attempts to predict what will happen in the future based on probability.
It simulates the behavior of the atmosphere, and each model incorporates a huge number of parameters and variables into its calculations.
These are supercomputers trying to forecast the weather of the future.
Their reliability is never absolute; sometimes they get it wrong, as we say, even if most of the time they are remarkably reliable.
The best approach is to compare them with each other to obtain a reliability indicator that is as close to reality as possible.
In Tarifa, if we look at the spots of “Los Lances” or “Valdevaqueros”, we have no fewer than 9 forecast models available on Windguru. There are 5 for general weather forecasts (which are especially important for wind) and 4 for swell and tide forecasts.
The first table, WG (Windguru Model Mix), is not actually a model but a weighted average of all the models listed for your Windguru spot.
It is very useful for getting a clear overview of upcoming trends over the next few days, but it is not very precise in terms of resolution.
Model Data on Windguru
Each Windguru table displays a set of weather data. Days and hours are arranged vertically, while the specific forecasts are aligned horizontally. For kitesurfing, the main information to consider is:
Wind Speed (in Knots)
This is the average wind expected over a 10-minute sample at a height of 10 m above the ground.
By default, wind is expressed in knots (1 knot = 1.852 km/h). It is possible to display other speed units by clicking on the “wind speed” line.
The color provides a more intuitive indication of speed. The warmer the color (red, purple, etc.), the stronger the wind will be.
Modified Wind or Wind Gusts
These indicate the difference between the constant average wind and an estimate of variations caused by terrain or specific wind effects such as thermals or Venturi effects.
In general, in Tarifa we observe a larger difference when the wind comes from the East (Levante), because it has to pass over the small mountains of the natural park, while Poniente winds are often very stable.
Wind Direction
Represented by arrows similar to a compass rose.
 This is a NORTH wind, meaning it COMES FROM the north.
Another example: wind coming from the South-West:

This allows you to determine the wind direction at the spot: Side / Side-On / Side-Off / On-Shore / Off-Shore.
Temperatures
Expressed in degrees Celsius and measured at 2 m above the ground. Useful for choosing the right wetsuit.
Windguru does not display water temperature, so you will need to look for this information on other websites.
Cloud Cover (High / Mid / Low)
Expressed as a percentage, it indicates the amount of clouds present at different altitude levels.
Basically, the grayer it is, the more overcast the sky will be.
Precipitation
Represents the amount of rain in mm/m² over a 3-hour period.
This is important data for kitesurfing! Riding in the rain is not very pleasant, and above all you should consider the risk of thunderstorms.
A change in wind direction or strength combined with rain is usually not a good sign.
The Windguru Rating
The Windguru rating is a visual indicator that quickly evaluates the quality of conditions for windsurfing, mainly based on wind speed. It appears as a star rating system:
- 1 star: Acceptable conditions, requiring the use of larger sails.
- 2 stars: Good conditions, suitable for medium-sized sails.
- 3 stars: Excellent conditions, ideal for smaller sails.
By default, blue stars indicate temperatures of 10°C or less, a threshold that you can customize in your user settings.
Bonus: What Windguru Can Struggle to Predict
Although extremely powerful for forecasting, Windguru cannot predict subtle local effects such as thermal winds like those at Valdevaqueros or Los Lances, or the specific influence of the mountainous terrain around Tarifa.
Windguru can also miss micro weather events, such as isolated clouds, thunderstorms, or rapid wind changes that are not predicted by the main models.
Thermal Winds – Sea Breezes
A thermal wind is typically a phenomenon that Windguru or other weather models cannot predict.
These ultra-local events can be significant over very short areas (sometimes less than 2 km).
This happens very regularly in the bay of Valdevaqueros, especially in spring and autumn.
It is perfectly possible to have a forecast of less than 12 knots on all models, but the temperature difference, usually in the early afternoon can regularly trigger a thermal wind of 18 to 20 knots.
The key on Windguru is to compare!
To summarize, the broader the resolution of the model you observe, the more it should be interpreted as a trend.
This is perfect when you are planning your kitesurf trip to keep an eye on forecasts one week to 10 days in advance.
Conversely, the more you look at a high-resolution model, the more reliable the data will be, but over a shorter period of time.
If you are on site, I recommend mainly taking into account Windguru models with a resolution below 7km to plan upcoming sessions, for the same day or the following day.
A model is never infallible, it is only the result of a large calculation that determines a forecast.
Ideally, you should always compare different models with similar resolutions. For example: WRF 3km Vs Zephr-Hd-4Km.
This then allows you to determine the reliability of the forecasts, a kind of confidence index.
Become the Guru of Your Kite Spot
You are now able to read wind forecasts on Windguru and determine where and when you should be to catch an amazing kitesurf session.
Some models also include additional data, such as wave direction and periods, as well as tides. Very useful if you are a wave hunter.
Note: Don’t hesitate to check the page of the best kitesurf spots in Tarifa depending on the wind direction.
Real-time weather station on Windguru
In Tarifa, there is a weather buoy that shows the wind in real time.
This is no longer a forecast, but a display of the wind at the moment.
It is located at the campo de football just outside the town. To access it, go to the top left of the Windguru Los Lances table.
By clicking on the data from the campo de football buoy, you can view a graphical display of the wind and gusts in real time.
A second Windguru weather station is installed at Spin-Out for Valdevaqueros.
These real-time weather stations are not exclusive to Tarifa. They exist for many other spots as well, thanks to a service for purchasing or renting meteorological stations to install on site.
Other Weather Forecast Sites for Kitesurfing
Of course, Windguru is probably one of the best weather forecast sites for kitesurfers as well as windsurfers. However, there are other weather forecast sites that are also very useful.
Windfinder
Also well known among fishermen, paragliders, kitesurfers, and surfers, Windfinder.com is a weather forecasting site that offers only two types of model views.
Windfinder Forecast:
The Windfinder forecast block only presents the GFS model with a resolution of 13 km, so it is not possible to access the other weather models we are used to on Windguru.
Windfinder Superforecast:
This is Windfinder’s advantage: the Superforecast seems to be a condensed version of fine-grid models (7 km), but we do not know exactly which models Windfinder uses to generate its forecasts.
Windy
Windy.com offers an interesting interactive map that displays forecasts from several weather models such as:
ECMWF – GFS – ICON – NEMS
One of its main advantages is that it also provides rain radar integration and satellite data for cloud formations and hurricane tracking.
Windy is a comprehensive, interactive, and user-friendly site. Its main drawback is that on the mobile app, only a few models, such as GFS27, are available for free; a pro version is offered with a subscription.
Thus, Windguru, Windfinder, and Windy seem to form the top 3 best weather forecast sites and apps. Of course, there are other weather forecast sites that have their own advantages and disadvantages. Notable examples include
Ventusky;
Weather-Forecast;
AlloSurf; and many others that remain to be discovered and explored.
See you soon on the water.